Over the past few years, I have often heard that ‘Vancouver is the second least affordable city in the world.’ I usually use this metric to feel sorry for myself that I didn’t buy real estate right when I moved here 20 years ago.
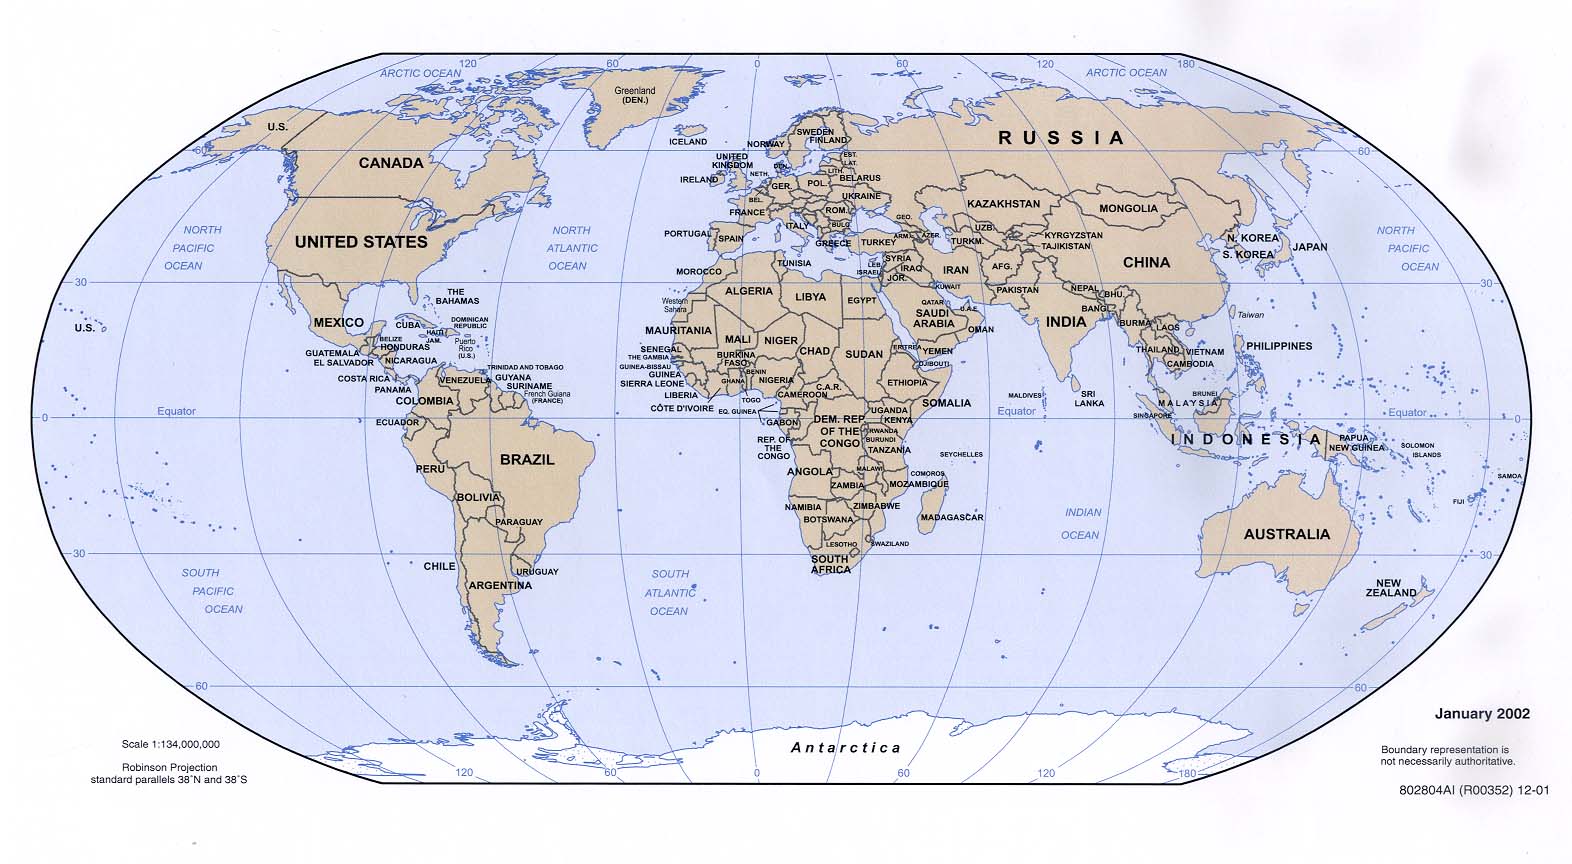
When people say the word "world", I usually picture this:

Apparently it’s second most expensive in a world of only 9 countries. Last time I checked (on Google) there were 265 countries! While the snob in me loves to be compared only to such cities as Tokyo, London and Paris, the picture actually changes a lot when other countries are brought into the equation. Jim Sutherland takes this up in an article, Vancouvers problem isn't high housing costs, it's stagnant incomes, in the March issue of BCBusiness:
… despite what so many media people and politicians have said, an affordability ratio around 10 does not make Vancouver “the second least affordable city in the world.” Not even close. In fact, in the context of “the world,” it’s about average.
From second most expensive to average?!! Indeed, the rankings, which are widely profiled in media around the world, are quite limited in its country sample. They are calculated the Demographia International Housing Affordability Survey. To be fair, the sample of countries represented in this publication is really clear, but somehow this is mostly lost in newspaper headlines and political briefings. Jim Sutherland points us to another source, Numbeo, which calculates the same affordability index - a ratio of median house price to median household income- and ranks 500 cities in 150 countries. Vancouver is 215th least affordable. Data are contributed by users.
Jim Sutherland isn’t the only who is pondering the usefulness of the Demographia survey data. Todd Litman, executive director of the Victoria Transport Policy Institute, takes issues with Demographia's calculation errors and a lack of transparency, in a series of blog postings over the last couple years. The last can be found here.
He points out that Demographia’s median house costs seem to primarily refers to larger-lot, single-family homes, and not the housing mix in Vancouver. The word ‘seem’ here is appropriate because the report isn't clear where the data are sourced and its assumptions. For instance, house prices don't correspond to data reported by the Real Estate Board of Greater Vancouver for 2014. He also suggests that a weighted price based on the mix of housing types would be significantly lower.
The media do love to metrics and numbers, and too often they are taken at face value. Often this is because there are no other data out there that are packaged nicely for media. When they are, it is good to ask if there may be some kind of agenda attached. The Fraser Institute's school rankings is another one that comes to mind. (For an interesting analysis of the method used in these rankings, see Donald Gutstein's critique).
There are signs of hope. Journalism schools increasingly offer courses and even programs in 'data journalism', for instance Columbia University offers it as a speciality in a graduate program, and Carleton offers a data bootcamp for journalists. Let's hope this trickles up to some some more critical thinking and smart use of numbers in the future.
How does this relate to demonstrating our own value as community-based organizations? First, when you do draw on metrics out there, take some time to look at the assumptions, calculations and sources. Even if certain metrics speak to your own message, are you also validating poorly calculated data by using it? Is it appropriate to use numbers calculated in one context in a different one? Are you including basic information that would help your audience understand the metrics?
Second, while open data are great, they are usually in a pretty raw form and require some number crunching to make sense of them. We use rankings from the Fraser Institute and Demongraphia because often there is no alternative. Let's encourage independent and transparent data and analysis that is publically accessible, useful to community and would stand up to peer review.
